
ROOFTOP SOLAR IS HAVING A RECORD YEAR – AND THE SOUTH WEST IS NEAR THE FRONT OF THE QUEUE
Government figures published at the end of August show that close to 172,000 solar installations have been completed across the UK since the start of 2026. For the first time, the Department for Energy Security and Net Zero (DESNZ) has also broken the numbers down by region – and the South West is one of the busiest parts of the country.
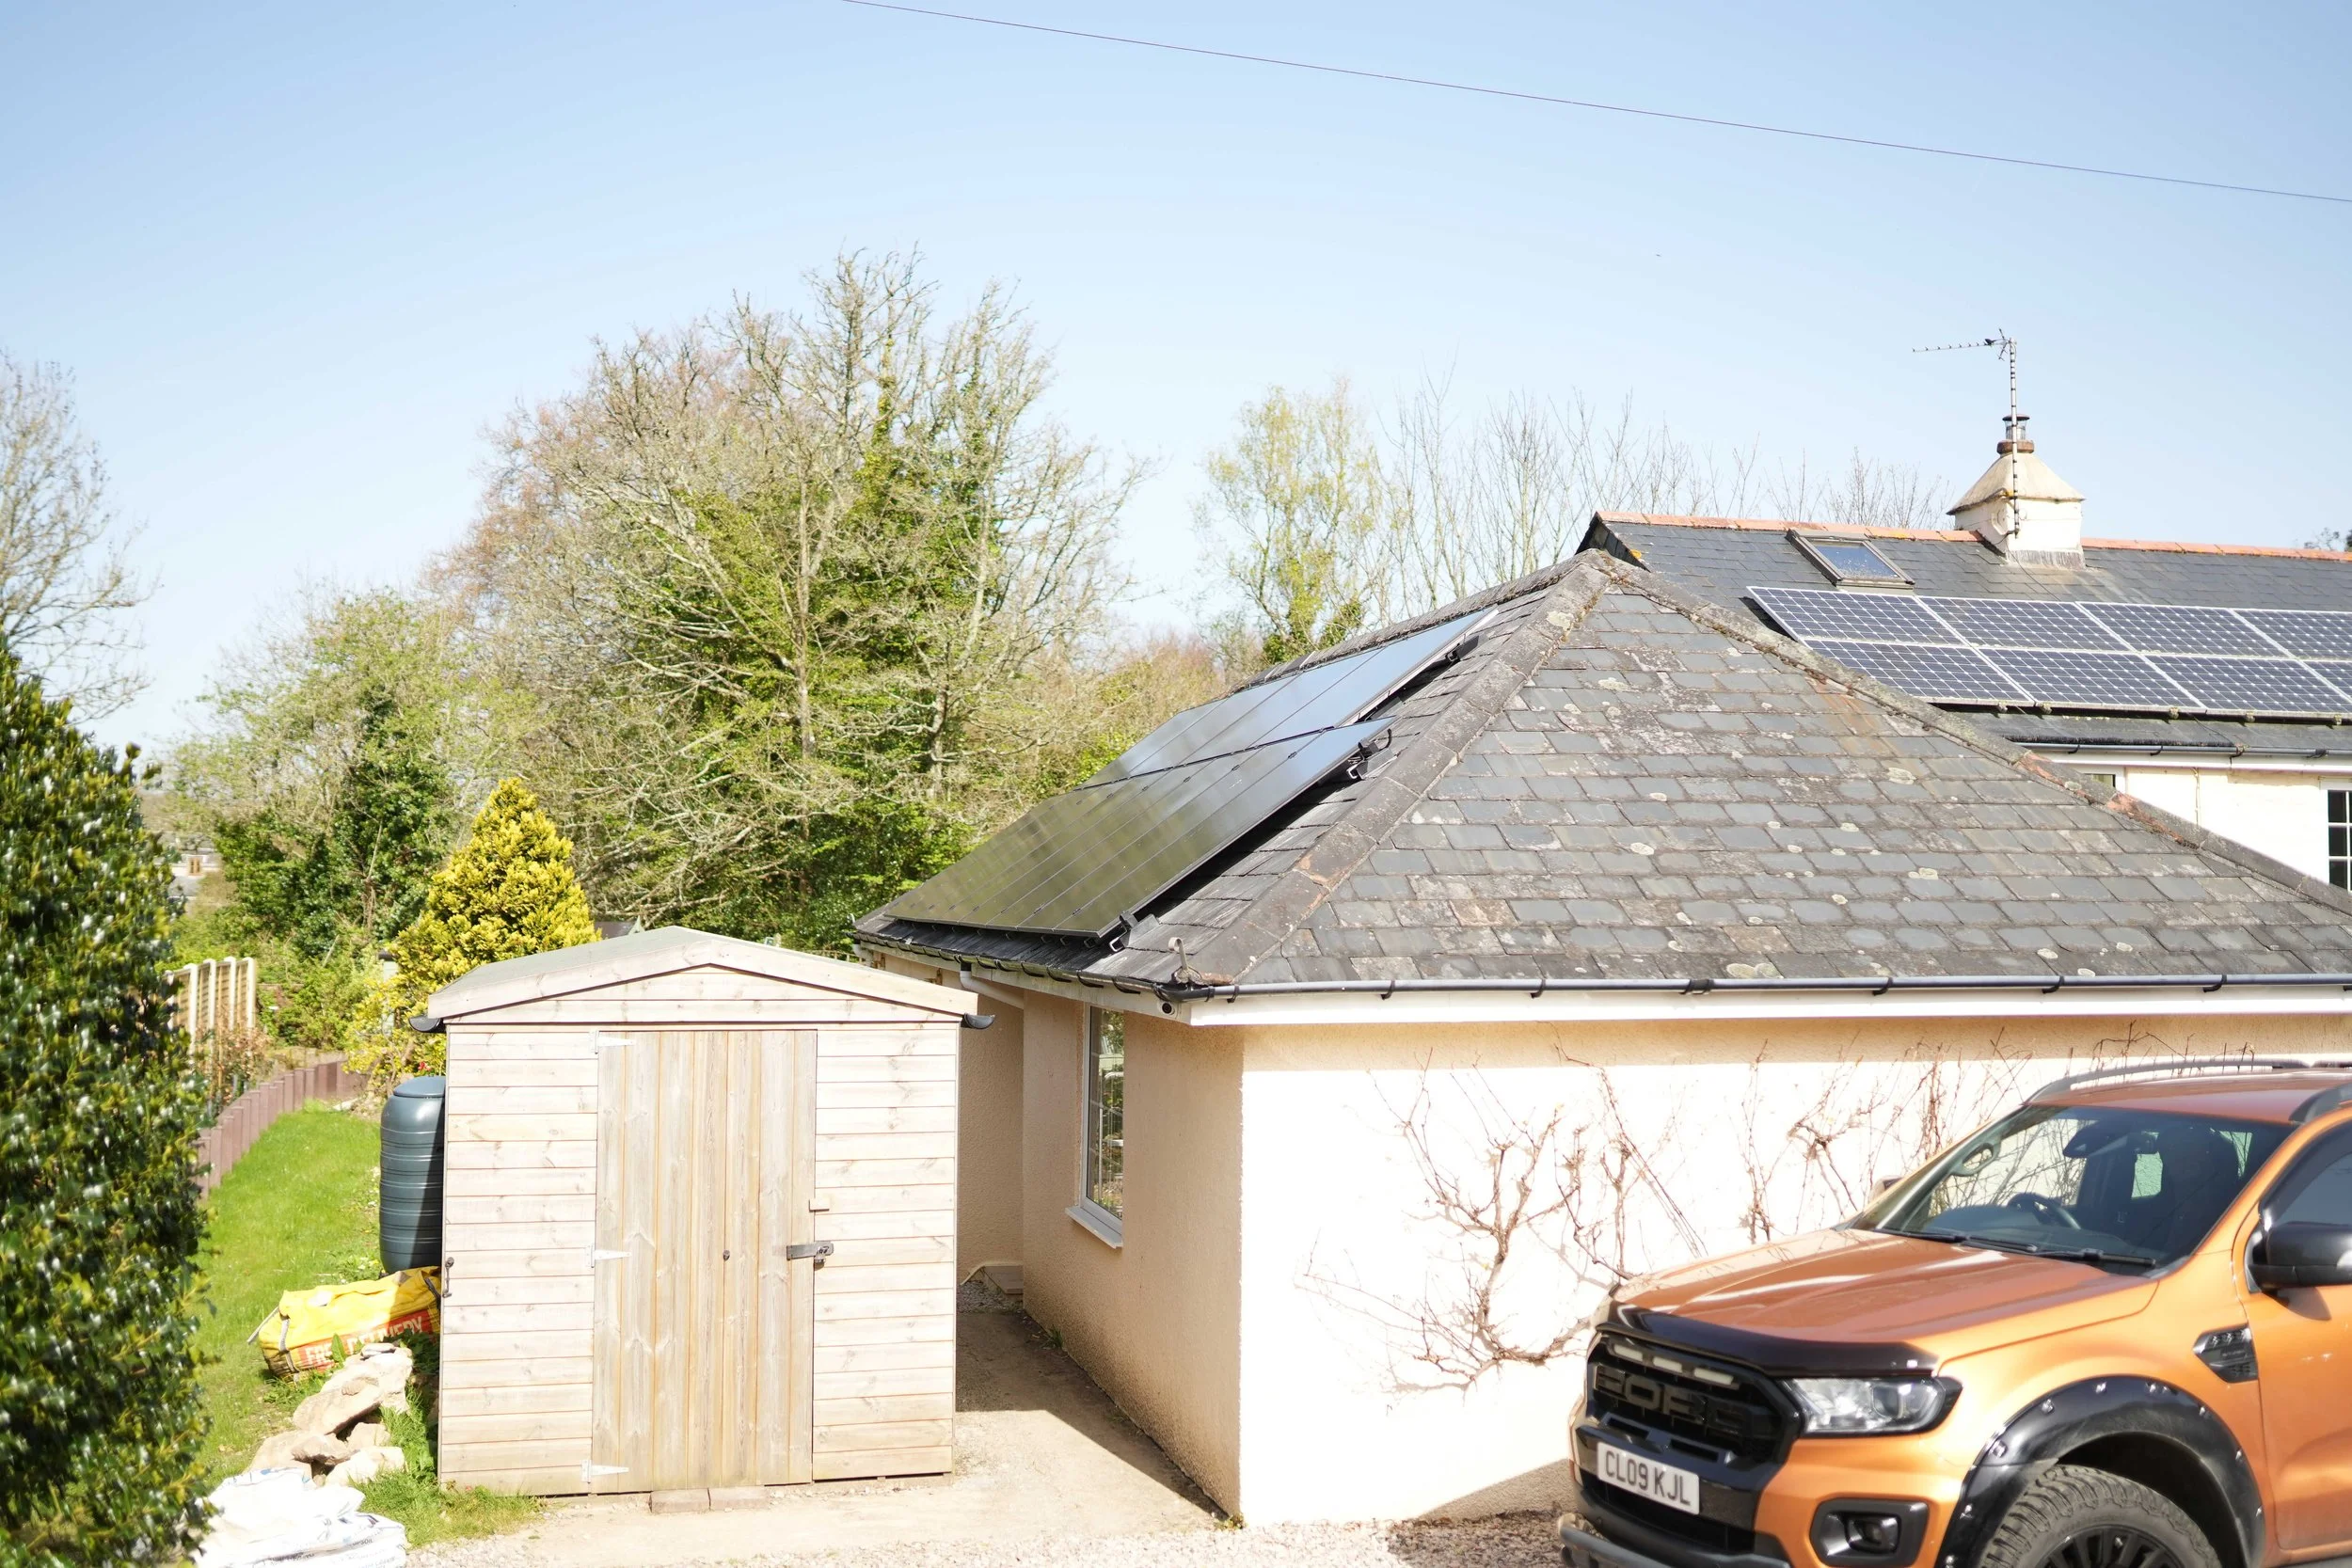
The South West is one of the busiest parts of the country.
The headline numbers
According to DESNZ, nearly 172,000 solar systems were installed across the UK between January and July 2026. July alone accounted for almost 28,000 installations, which is the third-highest monthly total ever recorded.
solar systems installed across the UK
installations
of July's installations
were rooftop systems
What stands out is where that growth is coming from. More than 19,800 of July's installations were rooftop systems. That’s over 70% of the month's total. Put another way, a rooftop solar system was being installed somewhere in the UK roughly every two minutes.
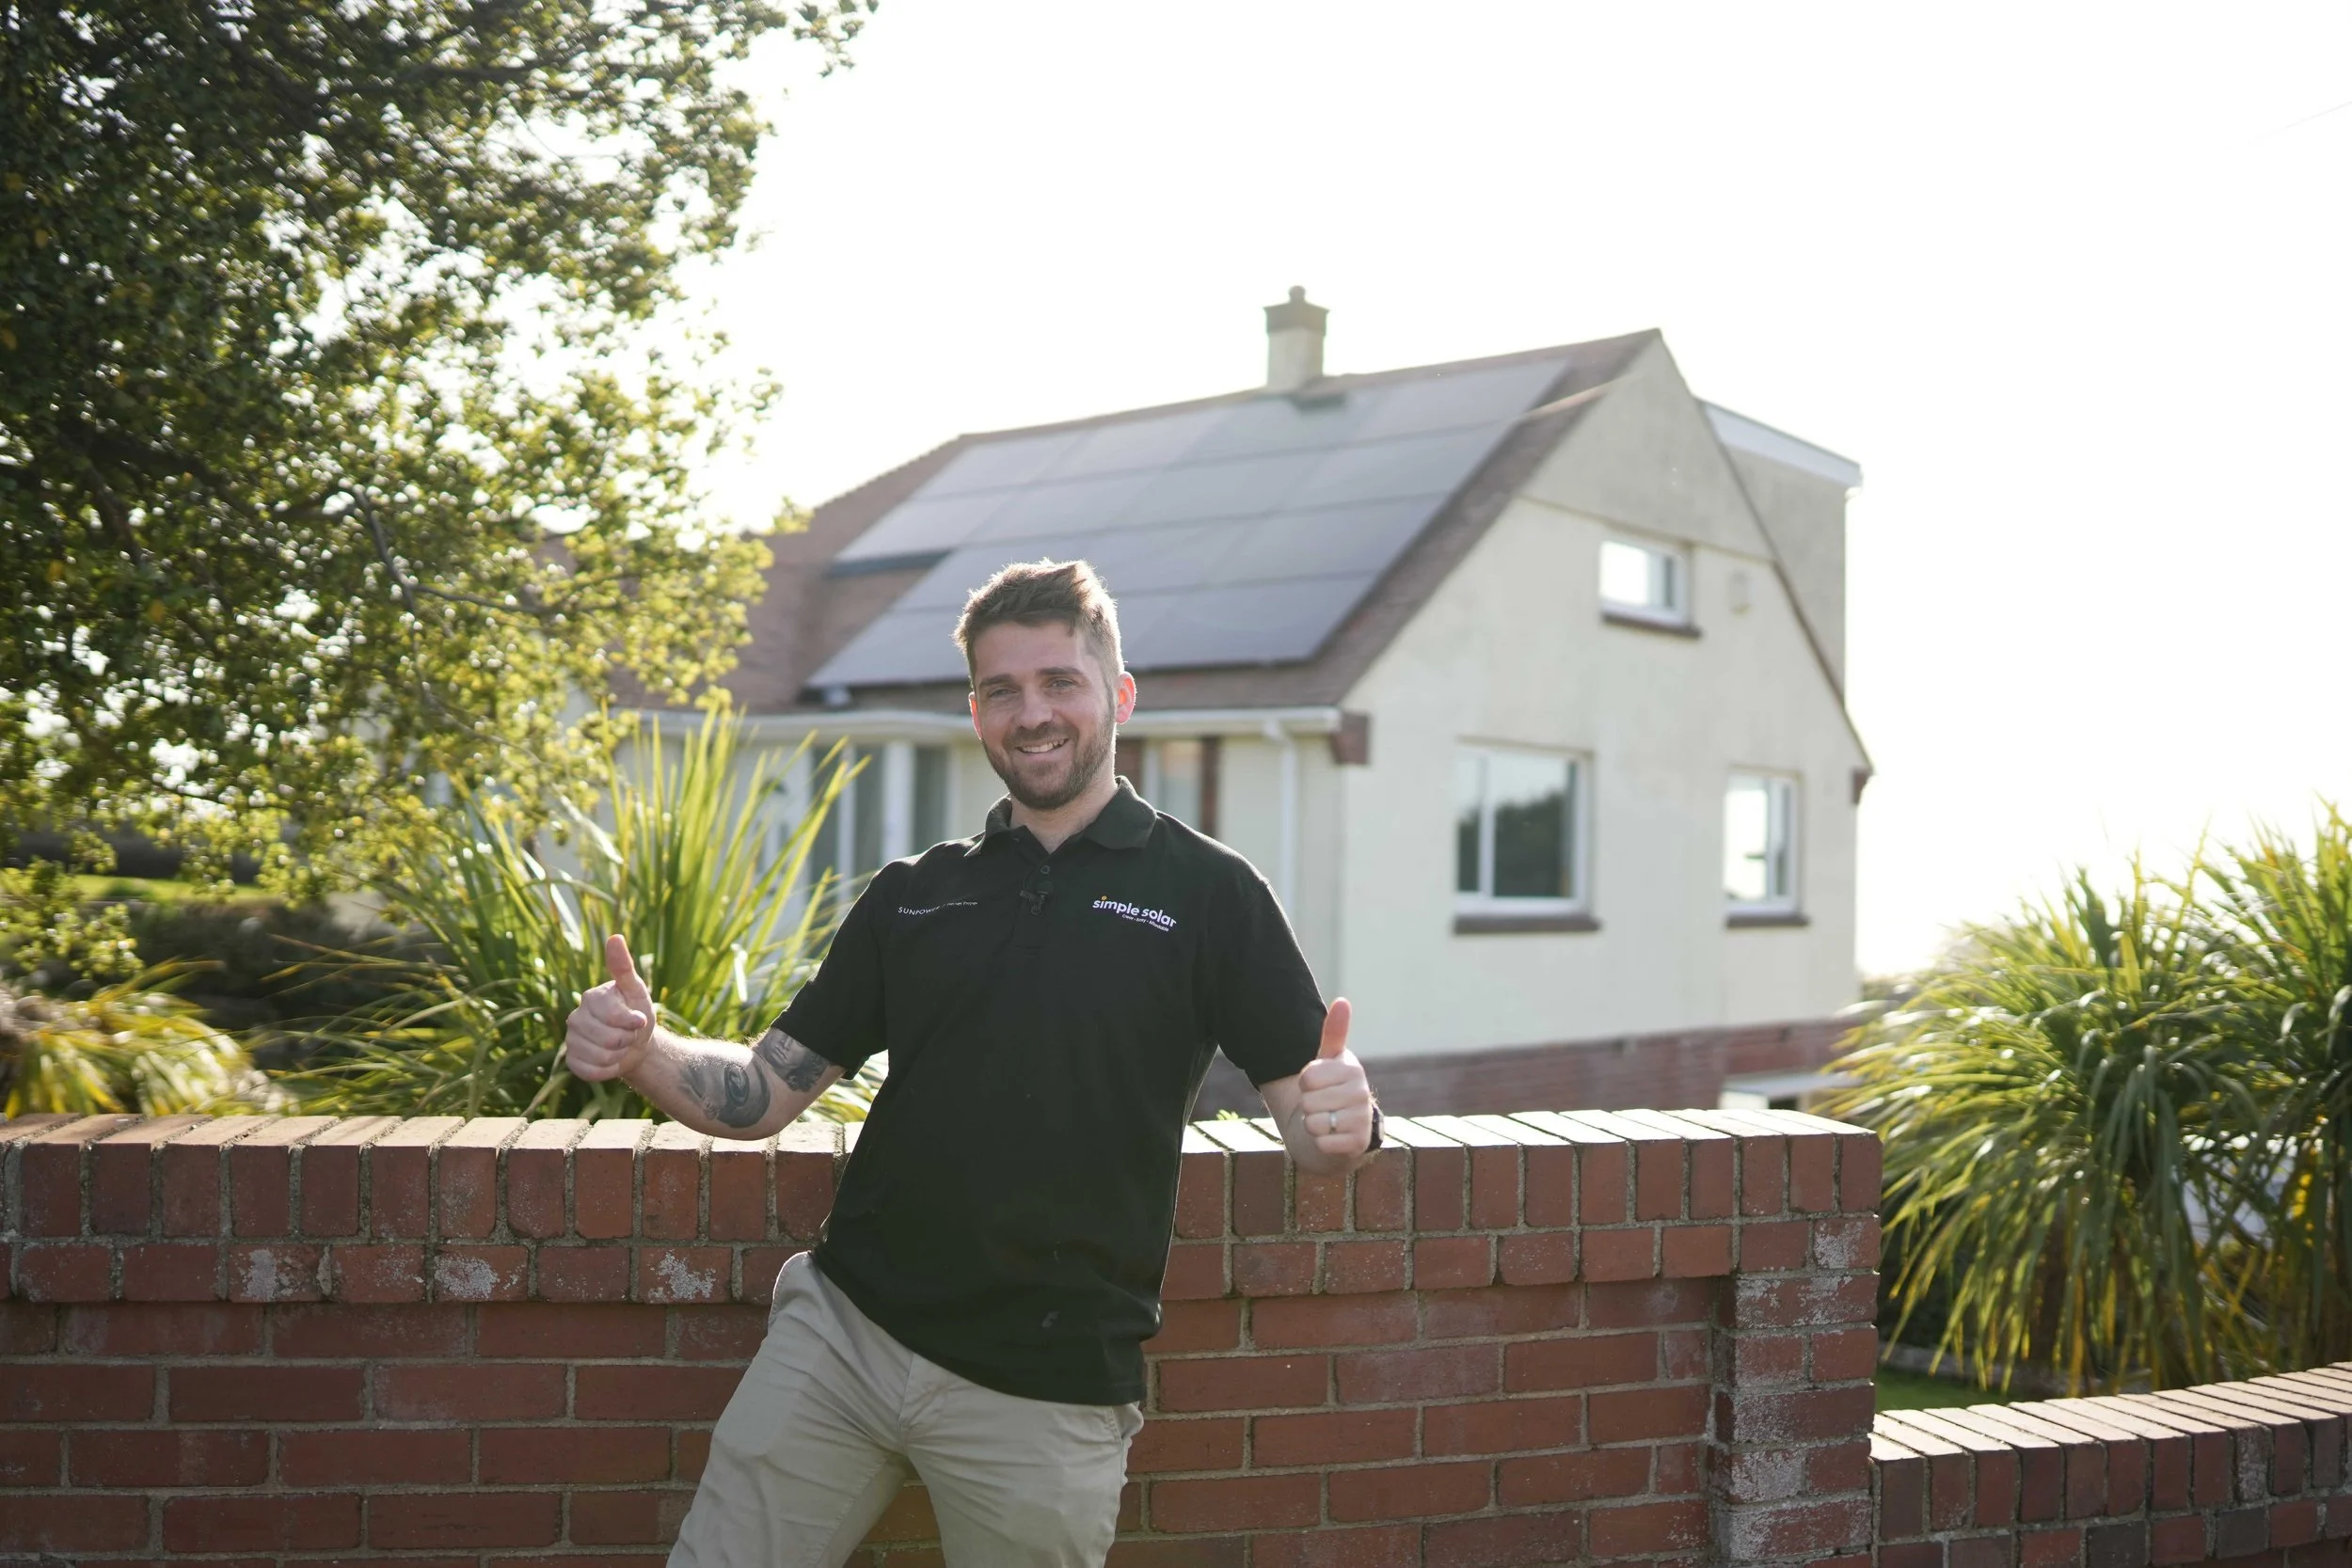
Record numbers of families are installing solar panels to generate clean, homegrown power, helping them cut their energy bills.
The figures build on a milestone reached earlier in the year. Solar Power Portal reports that the UK passed two million solar installations in March 2026, with total installed capacity of around 22.1 GW. Solar also supplied 14.4% of the UK’s electricity generation in July; a new monthly record, and well up on the 9.6% share recorded in July 2025.
This is the first time the government has published a regional breakdown alongside the national totals, so it is worth a closer look.
The South West recorded 17,539 solar installations in the 12 months to July 2026, a rise of 13% on the previous year. That takes the region's cumulative total to 271,400 installations; second only to the South East, which has 305,101.
-
01South East 22,628 installations in the past 12 months305,101 in total+14%
-
02South West 17,539 installations in the past 12 months271,400 in total+13%
-
03East of England 18,109 installations in the past 12 months241,195 in total+15%
-
04North West 15,927 installations in the past 12 months186,253 in total+16%
-
05East Midlands 15,981 installations in the past 12 months182,606 in total+17%
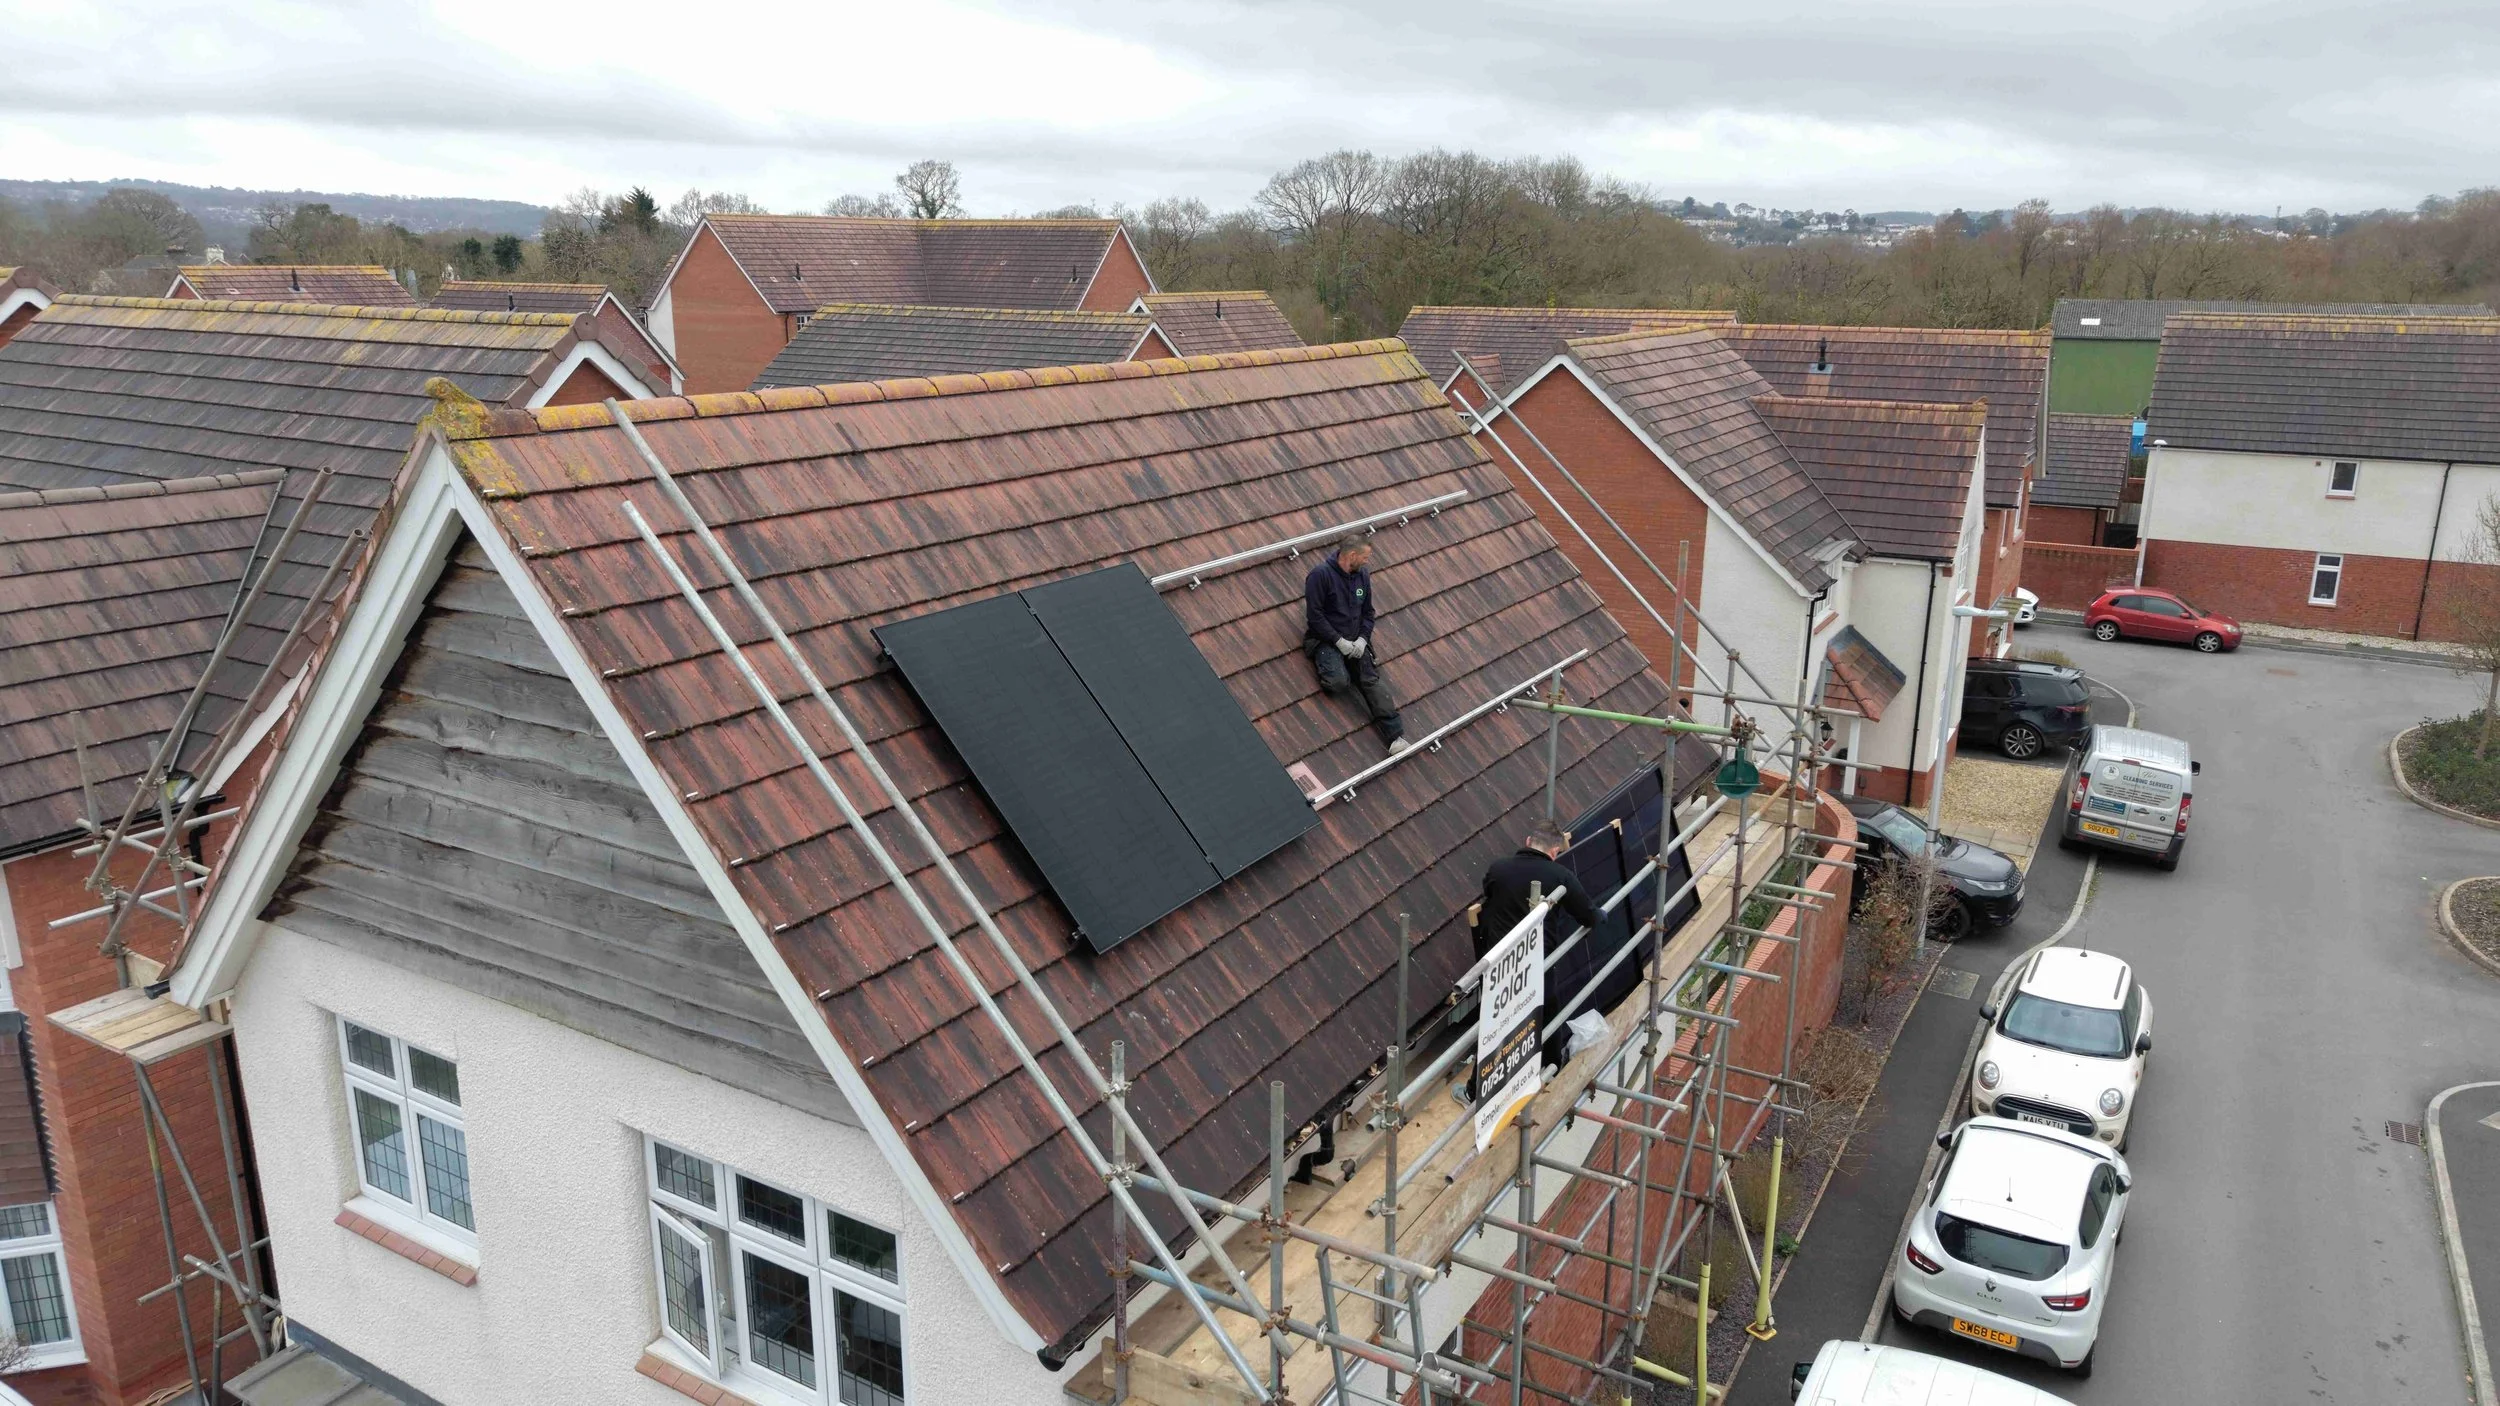 South West experience
Elsewhere, Wales saw the fastest growth of any nation or region at 18%, with Scotland up 14% and the North East up 11%.
Two things are worth noting for anyone in Devon, Cornwall or Dorset. First, the South West has one of the largest installed bases in the country, which means there is now a deep pool of local experience. Lots of installers, electricians, scaffolders and surveyors who have fitted thousands of systems on the kind of housing stock found across the region. Second, the 13% growth rate is slightly below the national pace, so despite the strong starting position there is still plenty of headroom on South West roofs.
The region already has one of the country's largest installed solar bases.
Strong adoption does not mean the South West has run out of suitable roofs.
Why homes rather than solar farms are driving the growth
It is easy to assume that headlines about solar growth are really about large ground-mounted solar farms. The July data says otherwise: rooftop solar systems made up more than seven in ten installations.
Several things are pushing in the same direction:
VAT on the installation of solar panels and batteries in homes is currently 0%, which takes a meaningful chunk off the upfront cost.
Battery storage has become a standard part of a home installation rather than an optional extra, allowing households to use more of what they generate and to take advantage of cheaper overnight tariffs.
And electricity prices, while below their 2022-2023 peak, remain high enough that a well-designed system on a suitable roof pays for itself well within its working life.
Plug-in solar
arrives too
On 27 August 2026 the government also confirmed new rules allowing ‘plug-in’ solar systems of up to 800W to be sold in the UK. These are small panels that plug into a standard socket rather than being wired into the consumer unit, and are aimed mainly at renters and flat-dwellers who cannot install a conventional rooftop array.
They are a welcome addition, but they are not a substitute for a full installation. An 800W plug-in kit will generate a fraction of what a typical 4 kW rooftop system produces, and it cannot be paired with a battery in the same way. For a home with a suitable roof, a properly designed and MCS-certified installation remains the way to make a real dent in energy bills.
Read our full guide Plug-in solar vs rooftop solar →What this means if you are thinking about solar in Devon
The national picture is clear: more households than ever are choosing solar, and the South West is one of the regions leading the way. If you have been weighing up an installation, a few practical points follow from the data.
Demand is high, so lead times can stretch. It is sensible to get a survey booked sooner rather than later, particularly if you want a system in place before the darker months.
The 0% VAT rate on domestic solar and battery installations offers a significant saving, but it is a temporary government policy. It is currently scheduled to run until 31 March 2027, after which VAT is due to return to 5% unless the government extends or changes the scheme.
Regional growth is being driven by ordinary homes, not just new-builds or large estates. The housing stock across Plymouth, South Hams, Torbay, Exeter and the wider county includes a great deal of south-facing roof space that is well suited to solar.

Based on the scheduled end date of 31 March 2027. Book a survey now to give yourself the best chance of completing before the rate changes.
If you would like to know what a system could generate on your roof, get in touch with the Simple Solar team for a free, no-obligation survey.
